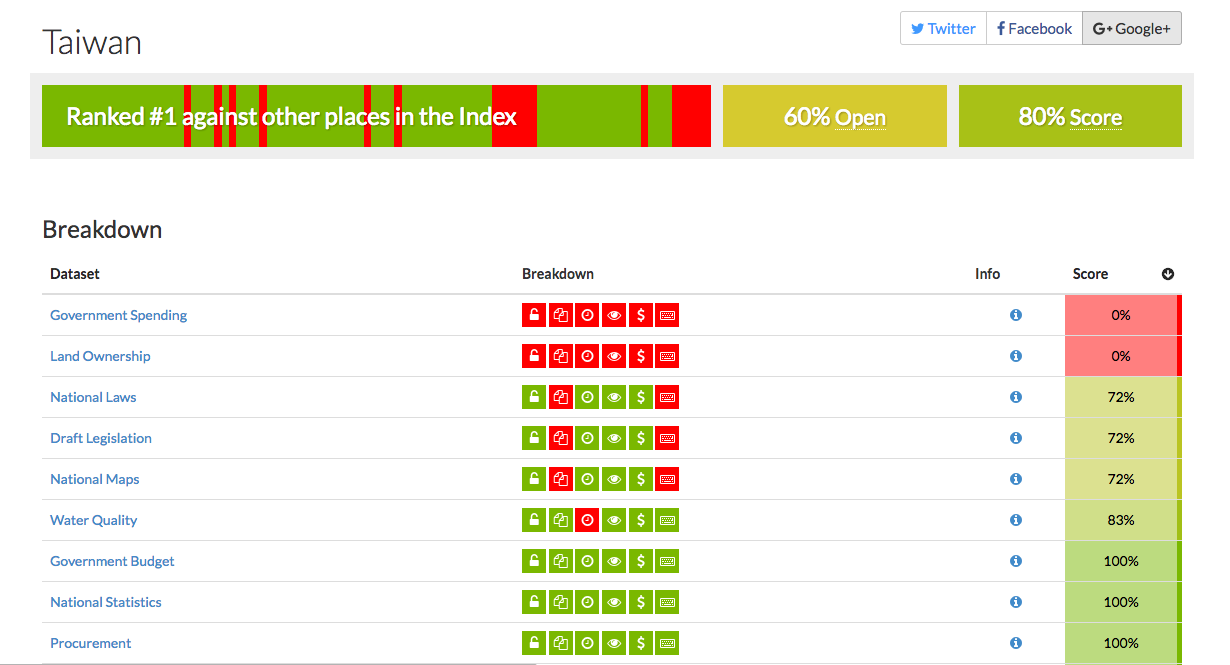
The Global Open Data Index (GODI) is a tool to educate civil society and governments about open data publication. It is also supposed to spark debate about the state of open government data. We do so through the presentation of different information, including ranking and scores for each data category per place and comments by our submitters and reviewers. The image below shows some of these elements in a country results page (here for Taiwan).
Even though we try to make this assessment as understandable and transparent as possible, it is not always easy to interpret the results. While open data has a very strict definition, scoring of any index is an arbitrary action. In real life, you can't be partly open - the published data either fits the criteria or it does not. So, what does the final score mean? How to interpret scores that vary between 0%, 40% or 70%? Here is some guidance on how best to read our results.
The Index refers to clearly defined data categories (e.g. budget, air quality, or national maps). Each data category contains specific data points drawing on international standards, as well as open data initiatives like Open Spending, Open Contracting, Opening Parliament or Open Corporates.
Our data categories strike a balance between feasibility and relevance - broad enough so that governments should be able to meet them, but also accurate enough to ensure that it describes usable information that is relevant and useful to the public. This balance allows for comparison between countries based on standard criteria, and gives a more realistic picture of the impact of the published open data publication (for more information, see our methodology page). This approach allows for the comparability of results and gives a realistic account of data identified as useful for the public.
For example, the Index exclusively looks at specific aspects of land data (land tenure), focusses on weather forecasts, and evaluates election data only if it is at polling station level. more information on our data categories can be found here. If our reviewers do not find data online that matches these characteristics, the data will not be considered to be available (equalling a score of 0%). Therefore a score of 0% does not mean that government does not publish open data at all - it means that the data that has been identified as relevant under our criteria based on information from civil society partners, is not available as open data.
This is different from previous editions. Back then, we applied our data definitions less strictly to take into account smaller progress made by governments. This year, we emphasise that within most of our data categories, data is especially useful if it is provided in a comprehensive manner. If some of the data is not provided, the usefulness of the data decreases significantly.
Not necessarily. Our scoring (ranging from 0% open to 100% open) does not necessarily show a gradual improvement. In fact, we assess very different degrees of data openness - which is why any score below 100 percent only indicates that a dataset is partially open. These levels of openness include public data, access-controlled data, as well as data gaps (See the index methodology). To understand the differences, we highly recommend reading each score together with our icons that indicate different aspects of open data.
For instance: a score of 70% can mean that we found access-controlled, machine-readable data, that cannot be downloaded in bulk. Any score below 100% means “no access”, “closed access” or “public access”. This is not open data. Here are some real-world examples of data we found online. We also explain how our results can be better interpreted.
Data is publicly accessible if the public can find it and view it online without any access restrictions. It does not imply that data can be downloaded, or that it is freely reusable. Often it means that data is presented in HTML format only on a website.
This image shows a search interface of a company register. It allows for targeted searches for individual companies, but does not enable the user to retrieve all data at once. Individual search results (non-bulk) are displayed in HTML format and can then be downloaded in PDF format (not machine-readable). Therefore, the score is 70% .

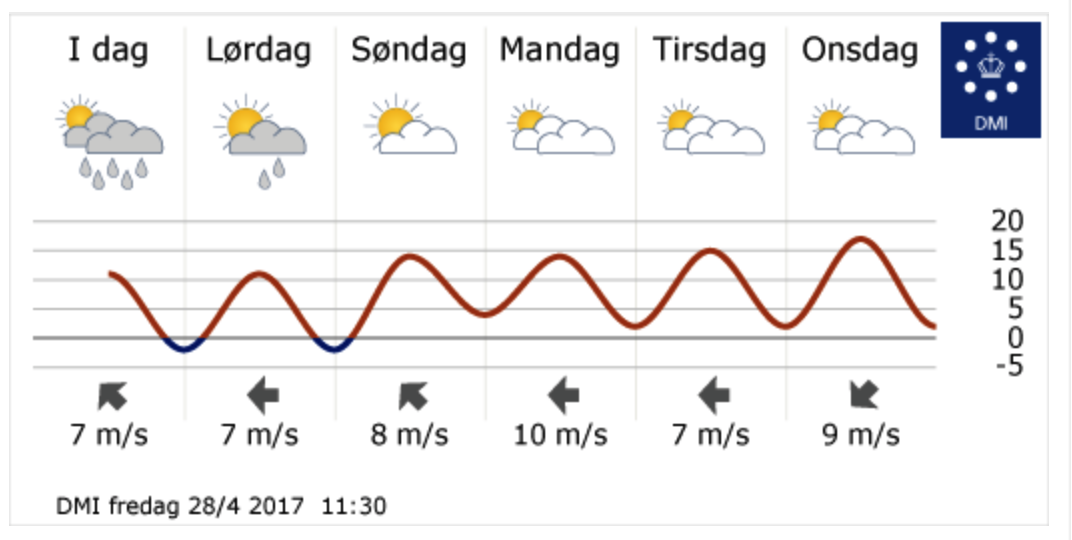
In the image below, we are able to view weather forecast data available in HTML. The data is publicly accessible, but cannot be downloaded without using a “scraper” tool that would automatically retrieve the values from the website. Some of the values, like the temperature graph cannot be retrieved at all. Also the data is legally protected by copyright and cannot be reused. The scoring: 45% (not machine-readable, not downloadable, no open license).
Data is access-controlled if a provider regulates who, when, and how the data can be accessed. Access control includes:
The reasons for controlled access are varied, including website traffic management, or to maintain control over how data is used. It is debatable whether some registration/authentication requirements reduce the openness of data (especially when registration is automated). Required use of data request forms on the other hand are simply unacceptable for open data.
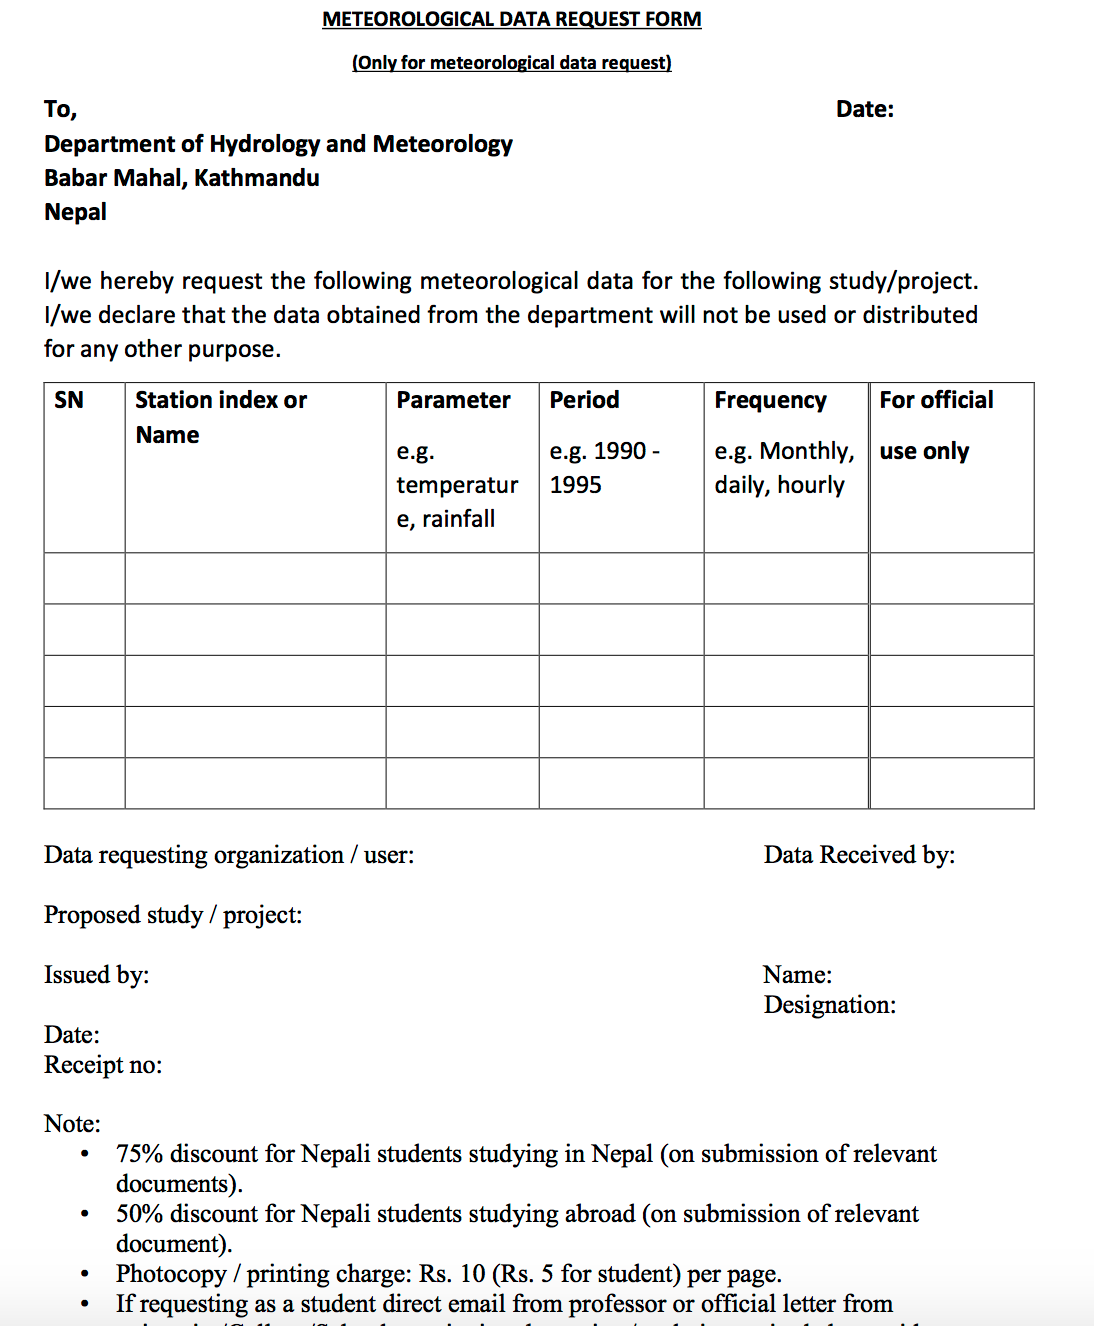
Maximum score: Up to 85%, indicating that all criteria of open data are met, but 15 points out of 100 deducted because users have to register online to be able to download.
This image shows a data request form (controlled access). The dataset is entirely hidden behind a “paywall”. Sometimes the costs are prohibitive, which prevents us from assessing the data at all. In this example, we were unable to verify the data format because the request form did not mention it. Since the data are available online, but need to be requested, the scoring amounts to 0%.
A data gap can mean that governments do not publish any data in a given category. Sometimes, if the Index shows a 0 percent score, we see data gaps. For instance, the case for Western African countries that lack air quality monitoring systems, or countries that have no established postcodes system. Data gaps indicate that the government information systems are not ready to produce open data, sometimes because resources are missing, sometimes because it is not a priority of government.
Sometimes government has the data, but for many reasons choose not to open it to the pu
Since our criteria requires a particular level of data granularity, we considered all datasets that do not meet this requirement as not granular, and therefore are regarded as not available. For example - Great Britain has published elections results, but not at the poll station level, which is a crucial level to detect voter fraud; therefore, while there is some data for UK elections, it is not at the right level, and is considered as non existent.
We are looking for particular datasets in the index. When they don't have all the characteristics we are looking for, we consider them as not available.